
The formalism behind each extraction cycle is itself very similar to the approach used by Powell & Holland (1985). In this special case, their approach was adapted to the 1/T vs. ln Kred plots. For each mineral reaction j the reduced equilibrium constant ln Kred can be expressed by

for the ith reaction constraint, here 1 or 2 for each reaction.
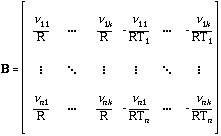
For a total of n reaction constraints this can be written as a matrix product:
![]()
The vector AR includes the reduced equilibrium constant ln Kred for each reaction at a given temperature Ti. These ln Kred values are the selected points in each 1/T vs. ln Kred plot. The elements of the rows of matrix B are the stoichiometric coefficients for each phase component in each reaction. The ΔfH° and S° values of each phase component are listed in vector D°, or:


In the next step an objective function for the optimization process must be defined. As discussed above, the following criteria were used for the extraction: (1) assemblages in each 1/T vs. ln Kred plot should be perfectly separated by the equilibrium line, i.e. as close as possible to the observed (obs) ln Kred values; (2) all third law entropies and enthalpies of formation should be close to the values determined by calorimetry. These criteria lead to the following objective function F:
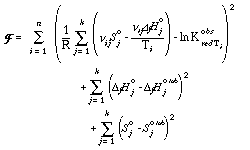
The superscript tab stands for a calorimetric, tabulated value. Using a least squares approach, the minimum for the objective function can be determined:
![]()
D° tab is a vector which includes the tabulated, i.e. calorimetric, reference entropies and enthalpies. E is the identity matrix. D° is the result and includes the optimized ΔfH° and S° values of each phase component.
The following modified objective function (cf. Powell & Holland, 1985) for the weighting scheme was used for the extraction of the internally consistent data set,
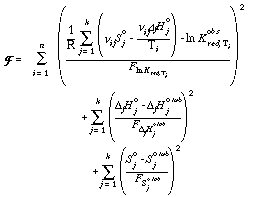
where the parameters F are the associated variances of ln Kred, ΔfHo, So and therefore 1/F are the weighting factors. The solution to F is obtained by:

The weighting matrix WAR for the manually selected points in the 1/T vs. ln Kred plots and the tabulated calorimetric values WD° tab are defined as follows:
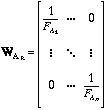
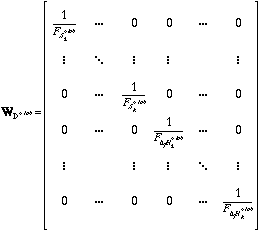
Again vector D° contains the optimized ΔfH° and S° values.
Calorimetric enthalpies and entropies of certain simple phases, especially elements and oxides, are considered to be well known experimentally. With this in mind, ΔfH° and S° values of corundum, hematite, iron, periclase, quartz, rutile, CO2, and O2 were used as anchors, along with the enthalpies and entropies for andalusite, kyanite and sillimanite from Hemingway et al. (1991).